
1. On your computer, open a spreadsheet in Google Sheets then double-click the chart you want to change.
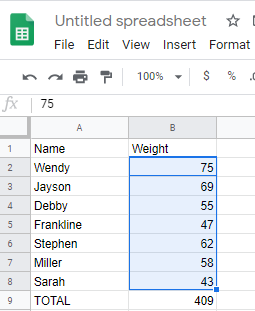
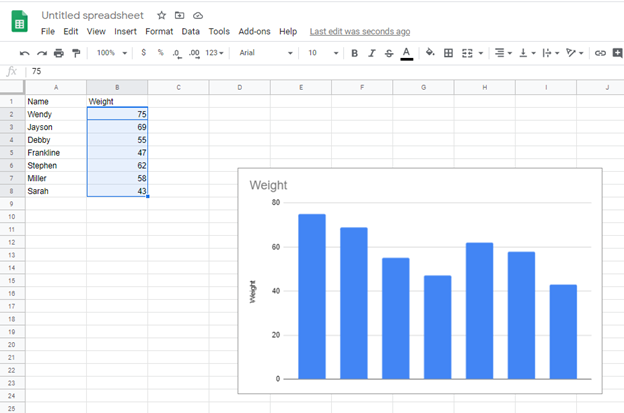
2. Select cells to be included in the chart
3.Click insert and then select a chart
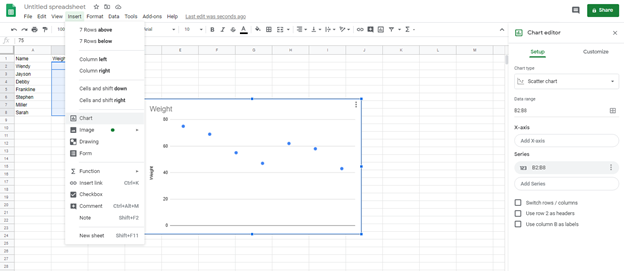
4. Change chart type
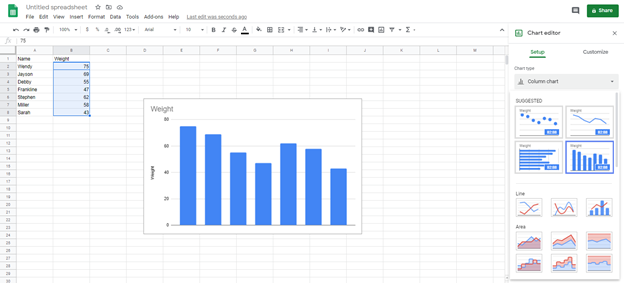
5.
Click y-axis then select the data range
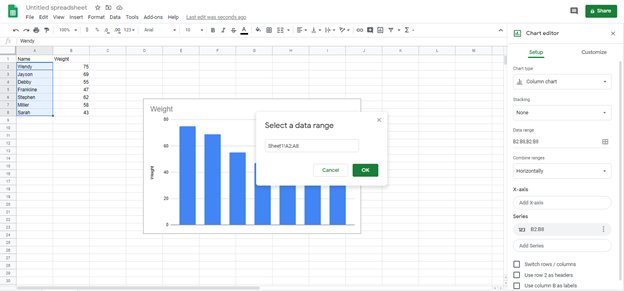
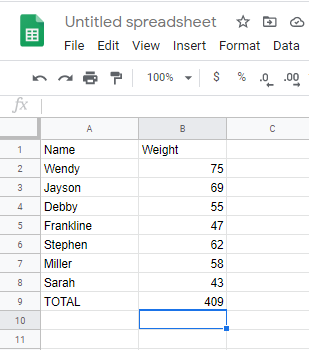
6. Click ok.
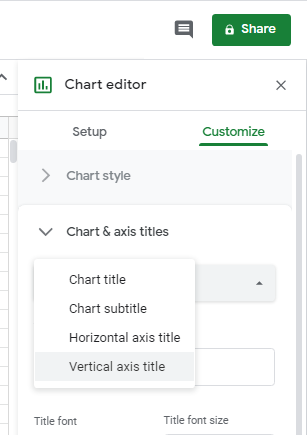
7. Click Customize, and then charts and titles to change the y-axis title, then select vertical axis
8. Edit your y-axis to the desired name
Under “Axis “choose right axis
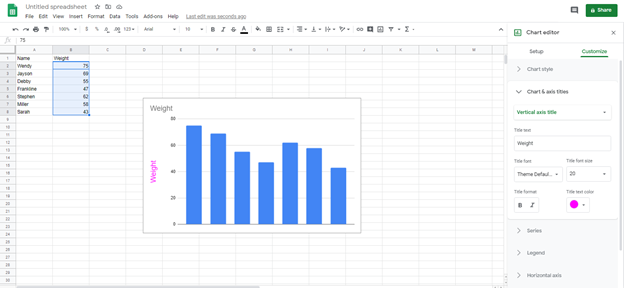
Optional; next to “apply”, choose the data series you want to appear on the right axis.