Google sheets is an online spreadsheet application that allows one to key in data and analyzes just like in Microsoft excel. Its advantage is that your data is automatically saved in google drive hence no risk of losing data even when the power goes off. Besides, it has more simplified formulas to do calculations and perform other activities. Furthermore, one can invite others to work on the spreadsheet with you. Also, it allows you to make changes to the file without having to destroy the original document. When you are done making changes, you can simply download it where sheets are going to convert it back to excel files, ready to be used by Microsoft excel once again.
Most people find it difficult to create a line of best fit or trendline in google sheets when they are required to. I’m going to show some simple steps on how to create a line of best fit in google sheets using examples in screenshots.
Steps for creating a line of best fit
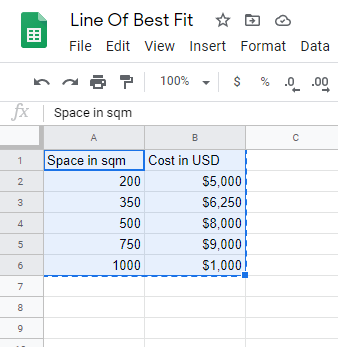
1. Ensure your data has two variables and each variable has a title as shown below. Select the data you want to appear in our graph as shown in our example.
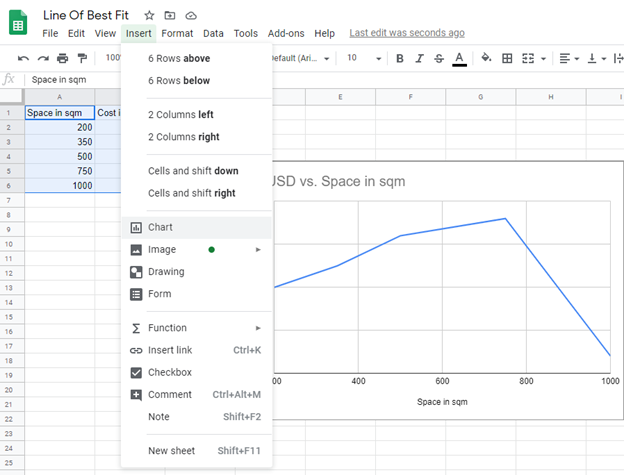
2. On the toolbar, click the Insert command then choose Chart from the options displayed on the pop-up menu. Automatically google sheets generate a graph as shown below.
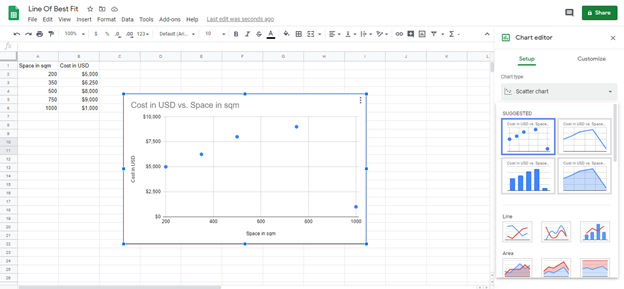
3. Click the Setup command to Change the Chart/ graph to scatter chart
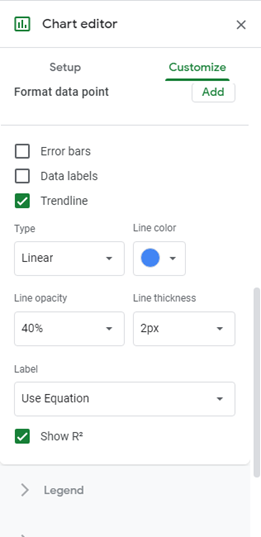
4. Click Customise command, Click Series, scroll down to trend line then Check Trendline. On Lebel command,
there is a box just below select Use Equation then check Show R2
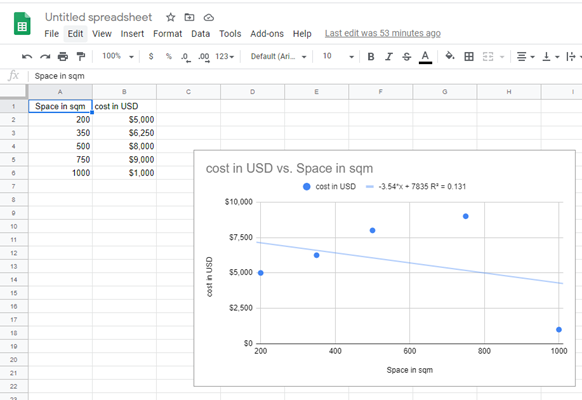
The scatter plot of your data will be displayed together with the line of best fit hence the data correlation strength can drown from the outcome as shown above. Also, one can hypothesize how the two variables are interrelated.
Working with google sheets can be such advantageous. Besides the above-mentioned benefits, working with google spreadsheets allows you to find the relationship in your data. This can be achieved through the graphs and tables feature found in google sheets which also helps create lines of best fit or trendline.