In order to compare two different sets of data you’ll need to use Google Sheets T-TEST function
The functions syntax looks like this
TTEST (array1, array2, tails, type) both refer to the same function.
- Array1 is the first data set
- Array 2 is the second data set
Tails represents the number of tails that are used for the distribution
You only have to options here;
- 1-one tailed distribution
- 2-two tailed distribution
Steps for calculating P value
Type represents an integer value which can be (paired T-TEST) and 2(two-sampled equal variance T-TEST)
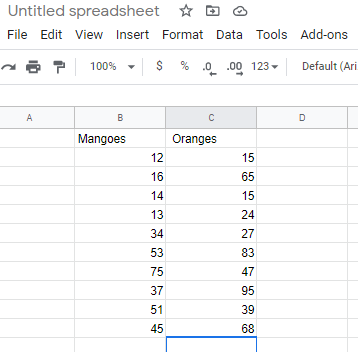
1. Use T-TEST function for google spreadsheet
Click on an empty column where you want to put your p value then type TTEST(enter the following formula:=TTEST(B2:B11,C2:C11,1,3)) as you can see B2:B7 signifies the starting and the ending point of our fist column you can simply hold your cursor at the first position(B2)and drag it to the bottom of the your column and Google Spreadsheets will automatically update your formula and do the same thing for the second column as well
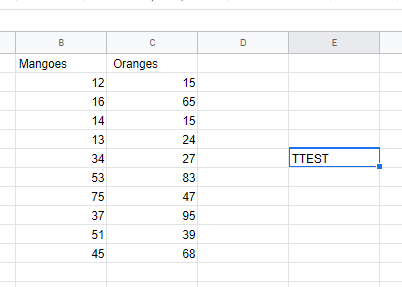
2. Input the TTEST formulae for the values to be varied (formula: =TTEST (B2:B11, C2:C11,1,3)
Highlight the first dataset and make sure your column is well selected
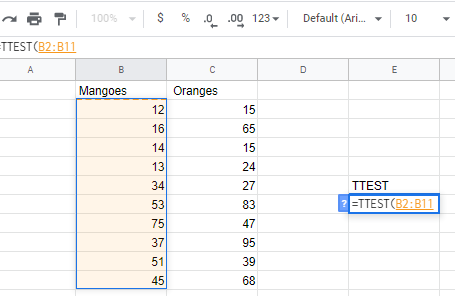
3. Put a comma then highlight the second dataset to be compared
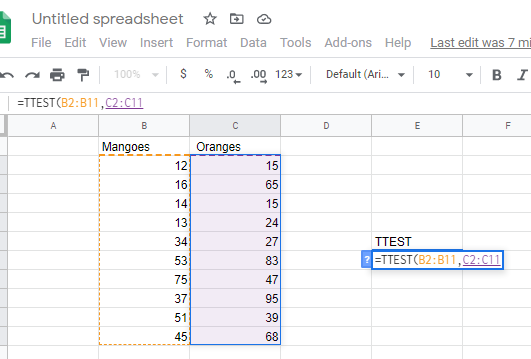
4. Put a comma then enter number of tails, then the type 3,
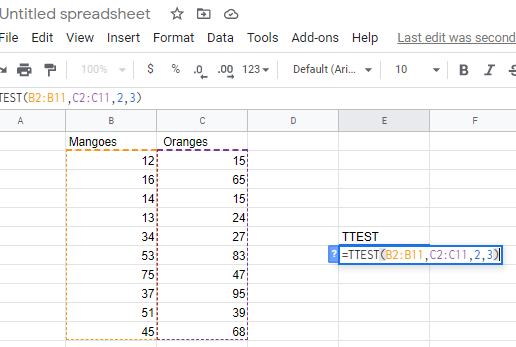
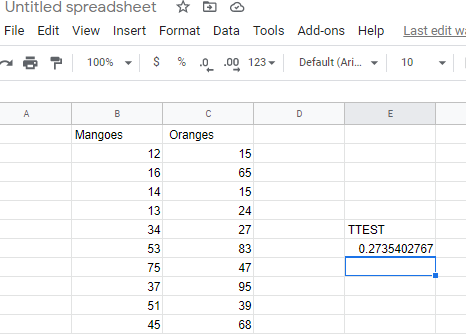
5. Click enter; your results should appear in the column where you have typed the formula (formula=B2:B11, C2:C11, 2, 3)
ttest
results
Common Error Messages
If you have made a mistake typing TTEST formula, you have probably seen one of these error messages
#N/A-displayed if your two data sets have different lengths
#NUM-displayed if the entered tails argument isn’t equal to 1-2.it can also be displayed if the type argument isn’t equal to 1-2, or 3
#VALUE! -displayed if you have entered on-numeric values from tails or type argument


