We can define a chart as a graphical data representation on a flat surface. A chart, in other words, can also mean a map. All data in a chart can be represented in the form of slices, lines, and symbols.
There are different types of charts we can create on the google sheets they include; pie chart which represents information in the form of slices, a bar chart does the representation of information in the form of symbols, and finally, the line chart does the representation of information in the form of lines.
To do the printing of charts in google sheets we follow a series of procedures that lead us all the way to the final step, some of them may include the following;
Step 1
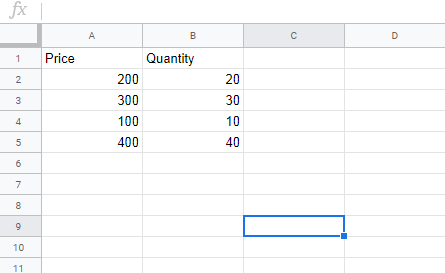
To print a chart on google sheets, first, we need to have the chart in place, we do this by creating a chart of our own. To create a chart, open a blank spreadsheet and insert some data into it as in the image below.
Step 2
The second step is to insert a chart of our data into our spreadsheet, highlight the data you have just created, and on the menu bar select insert.
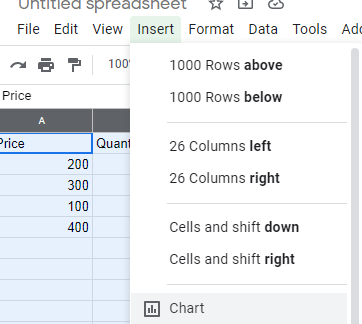
Choose the type of chart you would like to insert by clicking on the scatter chart from the right-side corner of the screen. In my case I am going to use column chart.

Step 3
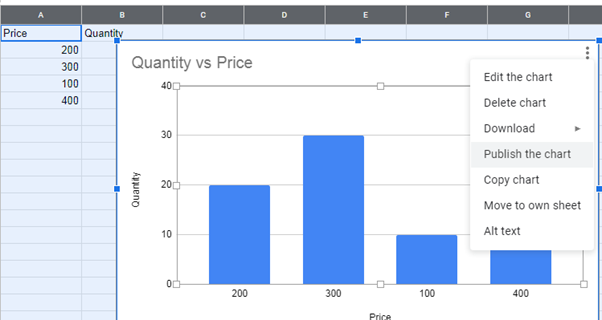
Once your column chart has appeared, double-click on it and select on more from the top-right side of the chart. The more button appears as three dots following each other going downwards.
Step 4
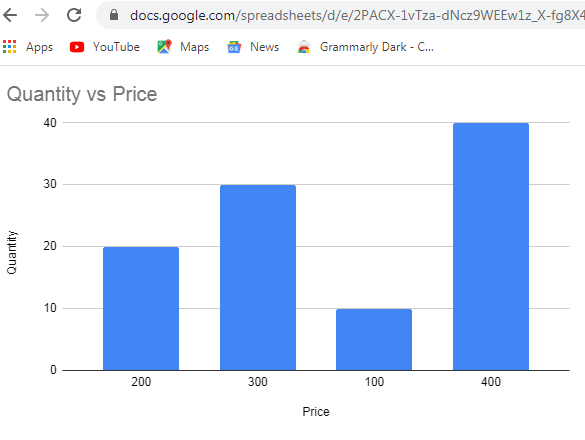
The final step of this procedure is now to publish our chart, click on publish chart and select the publishing option you would like to use, there are two of them, link publish and embed publish and finally click on publish.
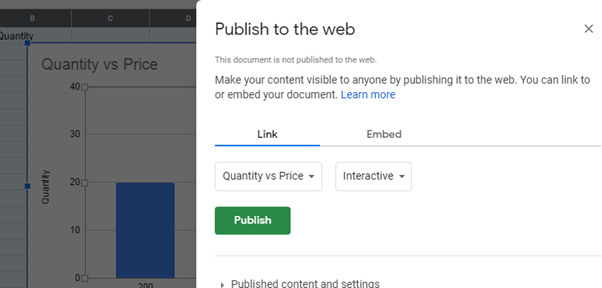
Once you click on publish, a link on your chart will appear, copy and paste the link on your favorite browser and upon clicking search, your chart will be successfully published on the google drive.
